Exercises#
In this exercise we will look at how substitution affects the vibrational frequencies, IR, and Raman spectra.
# import section
import numpy as np
import py3Dmol as p3d
import veloxchem as vlx
from matplotlib import pyplot as plt

basis_set_label = "6-31G"
# define molecules and basis sets
ethene_xyz = """6
 ethene
 C          0.000000    -0.663984   0.000000
 C          0.000000     0.663984   0.000000
 H          0.919796    -1.223061   0.000000
 H         -0.919796    -1.223061   0.000000
 H          0.919796     1.223061   0.000000
 H         -0.919796     1.223061   0.000000
"""
ethene = vlx.Molecule.read_xyz_string(ethene_xyz)
ethene_basis = vlx.MolecularBasis.read(ethene, basis_set_label, ostream=None)
fluoroethene_xyz = """6
fluoroethene
 C          0.000000    -0.663984   0.000000
 C          0.000000     0.663984   0.000000
 F          1.519796    -1.223061   0.000000
 H         -0.919796    -1.223061   0.000000
 H          0.919796     1.223061   0.000000
 H         -0.919796     1.223061   0.000000
 """
fluoroethene = vlx.Molecule.read_xyz_string(fluoroethene_xyz)
fluoroethene_basis = vlx.MolecularBasis.read(fluoroethene, basis_set_label, ostream=None)
chloroethene_xyz = """6
chloroethene
 C          0.000000    -0.663984   0.000000
 C          0.000000     0.663984   0.000000
 Cl         1.519796    -1.223061   0.000000
 H         -0.919796    -1.223061   0.000000
 H          0.919796     1.223061   0.000000
 H         -0.919796     1.223061   0.000000
 """
chloroethene = vlx.Molecule.read_xyz_string(chloroethene_xyz)
chloroethene_basis = vlx.MolecularBasis.read(chloroethene, basis_set_label, ostream=None)
view = p3d.view(linked=True, viewergrid=(1, 3), width=600, height=200)
view.addModel(ethene_xyz, "xyz", viewer=(0, 0))
view.addModel(fluoroethene_xyz, "xyz", viewer=(0, 1))
view.addModel(chloroethene_xyz, "xyz", viewer=(0, 2))
view.setViewStyle({"style": "outline", "width": 0.05})
view.setStyle({"stick": {}, "sphere": {"scale": 0.25}})
view.zoomTo()
view.show()
3Dmol.js failed to load for some reason. Please check your browser console for error messages.
SCF geometry optimization#
Before we can calculate the vibrational spectra, we first must optimize the geometries.
# Settings for SCF and gradient drivers
scf_settings = {"conv_thresh": 1e-6}
method_settings = {}
# Run SCF for ethene
ethene_scf_drv = ...
...

# Run SCF for fluoroethene
fluoroethene_scf_drv = ...
...

# Run SCF for chloroethene
chloroethene_scf_drv = ...
...
Show code cell source
# Run SCF for ethene
ethene_scf_drv = vlx.ScfRestrictedDriver()
ethene_scf_drv.update_settings(scf_settings, method_settings)
ethene_scf_drv.ostream.mute()
ethene_scf_results = ethene_scf_drv.compute(ethene, ethene_basis)

# Run SCF for fluoroethene
fluoroethene_scf_drv = vlx.ScfRestrictedDriver()
fluoroethene_scf_drv.update_settings(scf_settings, method_settings)
fluoroethene_scf_drv.ostream.mute()
fluoroethene_scf_results = fluoroethene_scf_drv.compute(
    fluoroethene, fluoroethene_basis
)

# Run SCF for chloroethene
chloroethene_scf_drv = vlx.ScfRestrictedDriver()
chloroethene_scf_drv.update_settings(scf_settings, method_settings)
chloroethene_scf_drv.ostream.mute()
chloroethene_scf_results = chloroethene_scf_drv.compute(
    chloroethene, chloroethene_basis
)
# Set up the gradient and optimization dirvers:
ethene_grad_drv = ...

fluoroethene_grad_drv = ...
...

chloroethene_grad_drv = ...
...
Show code cell source
# Set up the gradient and optimization dirvers:
ethene_grad_drv = vlx.ScfGradientDriver(ethene_scf_drv)
ethene_opt_drv = vlx.OptimizationDriver(ethene_grad_drv)

fluoroethene_grad_drv = vlx.ScfGradientDriver(fluoroethene_scf_drv)
fluoroethene_opt_drv = vlx.OptimizationDriver(fluoroethene_grad_drv)

chloroethene_grad_drv = vlx.ScfGradientDriver(chloroethene_scf_drv)
chloroethene_opt_drv = vlx.OptimizationDriver(chloroethene_grad_drv)
# Optimize the geometries
opt_ethene = ...
opt_fluoroethene = ...
opt_chloroethene = ...
Show code cell source
# Either optimize the geometries
# Uncomment below
# ethene_opt_drv.ostream.unmute()
# opt_ethene = ethene_opt_drv.compute(ethene, ethene_basis)
# fluoroethene_opt_drv.ostream.unmute()
# opt_fluoroethene = fluoroethene_opt_drv.compute(fluoroethene, fluoroethene_basis)
# chloroethene_opt_drv.ostream.unmute()
# opt_chloroethene = chloroethene_opt_drv.compute(chloroethene, chloroethene_basis)

# Or read them from file if already calculated
opt_ethene = vlx.Molecule.read_xyz_file("../../data/ir_raman/opt_ethene.xyz")
ethene_basis = vlx.MolecularBasis.read(opt_ethene, basis_set_label, ostream=None)

opt_fluoroethene = vlx.Molecule.read_xyz_file(
    "../../data/ir_raman/opt_fluoroethene.xyz"
)
fluoroethene_basis = vlx.MolecularBasis.read(opt_fluoroethene, basis_set_label, ostream=None)

opt_chloroethene = vlx.Molecule.read_xyz_file(
    "../../data/ir_raman/opt_chloroethene.xyz"
)
chloroethene_basis = vlx.MolecularBasis.read(opt_chloroethene, basis_set_label, ostream=None)
# Get optimized coordinates as xyz string
def get_xyz(molecule):
    natm = molecule.number_of_atoms()
    elements = molecule.get_labels()
    coords = molecule.get_coordinates_in_angstrom()
    txt = "%d\n\n" % natm
    for i in range(natm):
        txt += elements[i] + " %15.7f %15.7f %15.7f\n" % (coords[i,0], coords[i,1], coords[i,2])
    return txt
# Visualize the optimized structures
...
# Compute SCF with the optimized geometries of all molecules
...
Show code cell source
ethene_scf_results = ethene_scf_drv.compute(opt_ethene, ethene_basis)
fluoroethene_scf_results = fluoroethene_scf_drv.compute(
    opt_fluoroethene, fluoroethene_basis
)
chloroethene_scf_results = chloroethene_scf_drv.compute(
    opt_chloroethene, chloroethene_basis
)
Hessians#
Now, we can calculate the IR and Raman spectra for these optimized geometries.
# Settings for Hessian calculation
hessian_settings = {"do_raman": "yes", "print_depolarization_ratio": "no"}
# Create Hessian driver and update settings
ethene_vibanalysis_drv = ...
...

fluoroethene_vibanalysis_drv = ...
...

chloroethene_vibanalysis_drv = ...
...
# Compute the Hessians:
...
...
...
Show code cell source
# Create Hessian driver and update settings
ethene_vibanalysis_drv = vlx.VibrationalAnalysis(ethene_scf_drv)
ethene_vibanalysis_drv.update_settings(method_settings, hessian_settings)

fluoroethene_vibanalysis_drv = vlx.VibrationalAnalysis(fluoroethene_scf_drv)
fluoroethene_vibanalysis_drv.update_settings(method_settings, hessian_settings)

chloroethene_vibanalysis_drv = vlx.VibrationalAnalysis(chloroethene_scf_drv)
chloroethene_vibanalysis_drv.update_settings(method_settings, hessian_settings)

# Calculate
# ethene_vibanalysis_drv.compute(ethene, ethene_basis)
# fluoroethene_vibanalysis_drv.compute(fluoroethene, fluoroethene_basis)
# chloroethene_vibanalysis_drv.compute(chloroethene, chloroethene_basis)

# Or read from file:
import h5py

fname = "../../data/ir_raman/ethenes.h5"
hf = h5py.File(fname, "r")

labels = ["ethene", "fluoroethene", "chloroethene"]

i = 0
for driver in [ethene_vibanalysis_drv, fluoroethene_vibanalysis_drv, chloroethene_vibanalysis_drv]:
    label = labels[i]

    driver.hessian = np.array(hf.get(label + "_hessian"))
    driver.dipole_gradient = np.array(hf.get(label + "_dipolegrad"))
    driver.polarizability_gradient = np.array(hf.get(label + "_polgrad"))

    i += 1

hf.close()
# Broadening function
def add_broadening(list_ex_energy, list_osci_strength, line_profile='Lorentzian', line_param=10, step=10):

    ...

    return x, y
Show code cell source
# Broadening function
def add_broadening(
    list_ex_energy,
    list_osci_strength,
    line_profile="Lorentzian",
    line_param=10,
    step=10,
):
    x_min = np.amin(list_ex_energy) - 50
    x_max = np.amax(list_ex_energy) + 50
    x = np.arange(x_min, x_max, step)
    y = np.zeros((len(x)))
    # print(x)
    # print(y)

    # go through the frames and calculate the spectrum for each frame
    for xp in range(len(x)):
        for e, f in zip(list_ex_energy, list_osci_strength):
            if line_profile == "Gaussian":
                y[xp] += f * np.exp(-(((e - x[xp]) / line_param) ** 2))
            elif line_profile == "Lorentzian":
                y[xp] += (
                    0.5
                    * line_param
                    * f
                    / (np.pi * ((x[xp] - e) ** 2 + 0.25 * line_param**2))
                )
    return x, y
# To animate the normal mode we will need both the geometry and the displacements
def get_normal_mode(molecule, normal_mode):

    ...

    return vib_xyz
Show code cell source
# To animate the normal mode we will need both the geometry and the displacements
def get_normal_mode(molecule, normal_mode):
    elements = molecule.get_labels()
    coords = (
        molecule.get_coordinates_in_angstrom()
    )  # To transform from au to A
    natm = molecule.number_of_atoms()

    vib_xyz = "%d\n\n" % natm
    nm = normal_mode.reshape(natm, 3)
    for i in range(natm):
        # add coordinates:
        vib_xyz += elements[i] + " %15.7f %15.7f %15.7f " % (
            coords[i, 0],
            coords[i, 1],
            coords[i, 2],
        )

        # add displacements:
        vib_xyz += "%15.7f %15.7f %15.7f\n" % (nm[i, 0], nm[i, 1], nm[i, 2])
    return vib_xyz
Vibrational analysis#
To get a summary of the vibrational analysis, one simply needs to run the following command:
# Run for all molecules
ethene_vibanalysis_drv.vibrational_analysis(opt_ethene)
...
...
Show code cell source
# Run for all molecules
ethene_vibanalysis_drv.compute(opt_ethene, ethene_basis)
fluoroethene_vibanalysis_drv.compute(opt_fluoroethene, fluoroethene_basis)
chloroethene_vibanalysis_drv.compute(opt_chloroethene, chloroethene_basis)
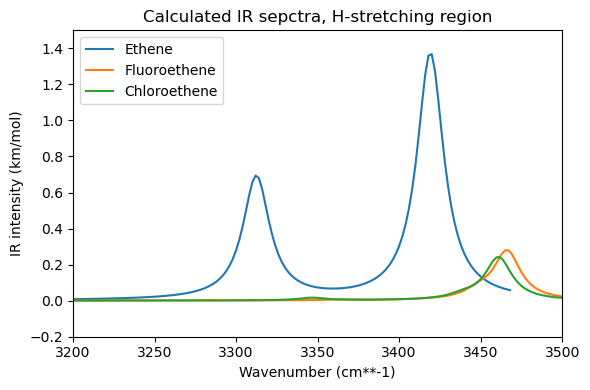
Think about the dipole moment of these molecules and consider the Hydrogen stretching modes. How do you expect the IR spectra to look like? Which molecule do you expect will have more intense IR-peaks?
# Plot the IR spectra
plt.figure(figsize=(6, 4))

eth_x, eth_ir = ethene_vibanalysis_drv.vib_frequencies, ethene_vibanalysis_drv.ir_intensities
flo_x, flo_ir = (
    fluoroethene_vibanalysis_drv.vib_frequencies,
    fluoroethene_vibanalysis_drv.ir_intensities,
)
chl_x, chl_ir = (
    chloroethene_vibanalysis_drv.vib_frequencies,
    chloroethene_vibanalysis_drv.ir_intensities,
)

eth_xl, eth_irl = add_broadening(
    eth_x, eth_ir, line_profile="Lorentzian", line_param=20, step=2
)
flo_xl, flo_irl = add_broadening(
    flo_x, flo_ir, line_profile="Lorentzian", line_param=20, step=2
)
chl_xl, chl_irl = add_broadening(
    chl_x, chl_ir, line_profile="Lorentzian", line_param=20, step=2
)

plt.plot(eth_xl, eth_irl, label="Ethene")
plt.plot(flo_xl, flo_irl, label="Fluoroethene")
plt.plot(chl_xl, chl_irl, label="Chloroethene")

plt.xlabel("Wavenumber (cm**-1)")
plt.axis(xmin=3200, xmax=3500)
plt.axis(ymin=-0.2, ymax=1.5)
plt.ylabel("IR intensity (km/mol)")
plt.title("Calculated IR sepctra, H-stretching region")
plt.legend()
plt.tight_layout()
plt.show()
# Plot the Raman spectra
plt.figure(figsize=(6, 4))
eth_x, eth_raman = ethene_vibanalysis_drv.vib_frequencies, ethene_vibanalysis_drv.raman_activities
flo_x, flo_raman = (
fluoroethene_vibanalysis_drv.vib_frequencies,
fluoroethene_vibanalysis_drv.raman_activities,
)
chl_x, chl_raman = (
chloroethene_vibanalysis_drv.vib_frequencies,
chloroethene_vibanalysis_drv.raman_activities,
)
freq = 0
eth_xl, eth_ramanl = add_broadening(
eth_x, eth_raman[freq], line_profile="Lorentzian", line_param=20, step=2
)
flo_xl, flo_ramanl = add_broadening(
flo_x, flo_raman[freq], line_profile="Lorentzian", line_param=20, step=2
)
chl_xl, chl_ramanl = add_broadening(
chl_x, chl_raman[freq], line_profile="Lorentzian", line_param=20, step=2
)
plt.plot(eth_xl, eth_ramanl, label="Ethene")
plt.plot(flo_xl, flo_ramanl, label="Fluoroethene")
plt.plot(chl_xl, chl_ramanl, label="Chloroethene")
plt.xlabel("Wavenumber (cm**-1)")
plt.axis(xmin=3200, xmax=3500)
plt.axis(ymin=-0.2, ymax=7)
plt.ylabel("Raman activity (A**4/amu)")
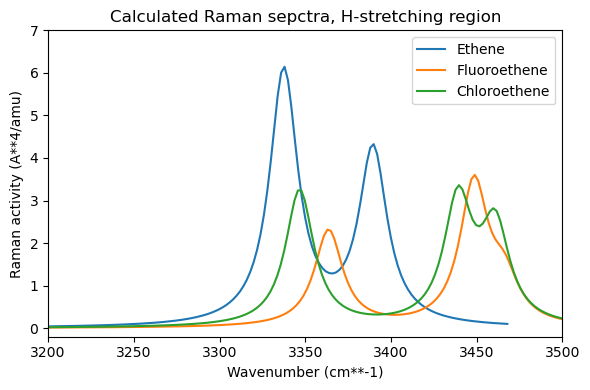
plt.title("Calculated Raman sepctra, H-stretching region")
plt.legend()
plt.tight_layout()
plt.show()
# Get the displacements of the normal mode
ethene_h1 = get_normal_mode(ethene, ethene_vibanalysis_drv.normal_modes[-1])
fluoroethene_h1 = get_normal_mode(
    fluoroethene, fluoroethene_vibanalysis_drv.normal_modes[-1]
)
chloroethene_h1 = get_normal_mode(
    chloroethene, chloroethene_vibanalysis_drv.normal_modes[-1]
)
# Animate the vibration
view = p3d.view(viewergrid=(1, 3), width=600, height=200, linked=True)
view.addModel(
    ethene_h1, "xyz", {"vibrate": {"frames": 10, "amplitude": 0.75}}, viewer=(0, 0)
)
view.addModel(
    fluoroethene_h1,
    "xyz",
    {"vibrate": {"frames": 10, "amplitude": 0.75}},
    viewer=(0, 1),
)
view.addModel(
    chloroethene_h1,
    "xyz",
    {"vibrate": {"frames": 10, "amplitude": 0.75}},
    viewer=(0, 2),
)

view.setViewStyle({"style": "outline", "width": 0.05})
view.setStyle({"stick": {}, "sphere": {"scale": 0.25}})
view.animate({"loop": "backAndForth"})
view.zoomTo()
view.show()
3Dmol.js failed to load for some reason. Please check your browser console for error messages.
IR intensities and Raman activities#
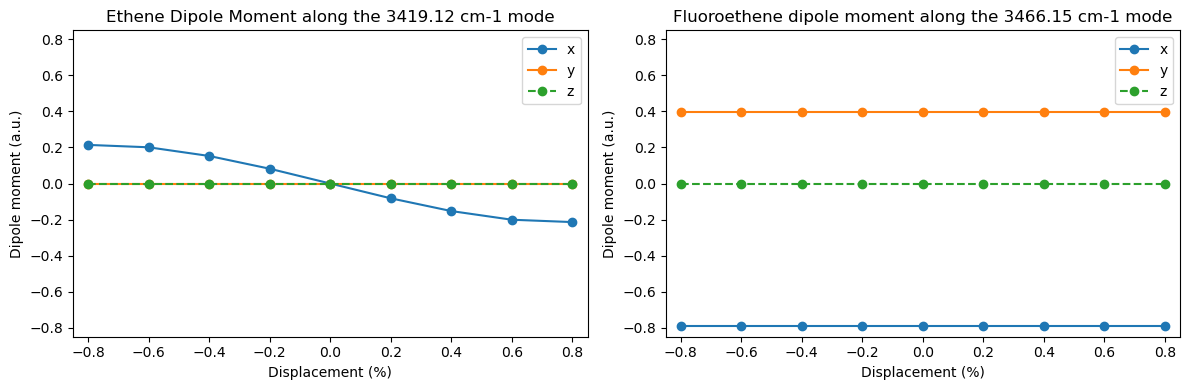
To rationalize why the IR and Raman spectra look as they do, calculate how the dipole moment and polarizability change during particular vibrational motions. Look at the Hydrogen stretching modes and select a mode which is IR-active in ethene, but is suppressed in fluoroethene or chloroethene. What is the dipole moment in the optimized molecule? How does the dipole moment change during the vibration?
# Calculate the dipole moment of the optimized molecules
# For this we will use the FirstOrderProperties class from veloxchem
ethene_prop = vlx.firstorderprop.FirstOrderProperties()
ethene_prop.compute_scf_prop(opt_ethene, ethene_basis, ethene_scf_results)
ethene_dipole_moment = ethene_prop.get_property('dipole moment')
...

# Select normal mode and get the array of atomic displacements
...

# Use the atomic displacement array to construct several new molecular configurations
# along the vibrational mode, e.g. -0.75, -0.5, -0.25, 0.25, 0.5, 0.75 displacement
...

# Calculate the dipole moment for the new configurations
...

# Plot as a function of displacement
...
Show code cell source
ethene_prop = vlx.firstorderprop.FirstOrderProperties()
ethene_prop.compute_scf_prop(opt_ethene, ethene_basis, ethene_scf_results)
ethene_dipole_moment = ethene_prop.get_property("dipole moment")

fluoroethene_prop = vlx.firstorderprop.FirstOrderProperties()
fluoroethene_prop.compute_scf_prop(
    opt_fluoroethene, fluoroethene_basis, fluoroethene_scf_results
)
fluoroethene_dipole_moment = fluoroethene_prop.get_property("dipole moment")

chloroethene_prop = vlx.firstorderprop.FirstOrderProperties()
chloroethene_prop.compute_scf_prop(
    opt_chloroethene, chloroethene_basis, chloroethene_scf_results
)
chloroethene_dipole_moment = chloroethene_prop.get_property("dipole moment")

print("Ground state dipole moments:   x             y            z       \n")
print(
    "Ethene                     : %5.2f a.u.    %5.2f a.u.   %5.2f a.u."
    % (ethene_dipole_moment[0], ethene_dipole_moment[1], ethene_dipole_moment[2])
)
print(
    "Fluoroethene               : %5.2f a.u.    %5.2f a.u.   %5.2f a.u."
    % (
        fluoroethene_dipole_moment[0],
        fluoroethene_dipole_moment[1],
        fluoroethene_dipole_moment[2],
    )
)
print(
    "Chloroethene               : %5.2f a.u.    %5.2f a.u.   %5.2f a.u."
    % (
        chloroethene_dipole_moment[0],
        chloroethene_dipole_moment[1],
        chloroethene_dipole_moment[2],
    )
)
print()

ethene_moments = []
fluoroethene_moments = []

natm = opt_ethene.number_of_atoms()

new_ethene_scf_drv = vlx.scfrestdriver.ScfRestrictedDriver()
new_ethene_scf_drv.ostream.state = False
ethene_displacements = ethene_vibanalysis_drv.normal_modes[-1].reshape(natm, 3)
ethene_labels = opt_ethene.get_labels()

new_fluoroethene_scf_drv = vlx.scfrestdriver.ScfRestrictedDriver()
new_fluoroethene_scf_drv.ostream.state = False
fluoroethene_displacements = fluoroethene_vibanalysis_drv.normal_modes[-1].reshape(natm, 3)
fluoroethene_labels = opt_fluoroethene.get_labels()

x_list = np.arange(-0.8, 0.81, 0.2)

# Calculate the dipole moment for different displacements
for x in x_list:
    ethene_coords = opt_ethene.get_coordinates_in_angstrom()
    ethene_coords += x * ethene_displacements
    new_ethene = vlx.molecule.Molecule(ethene_labels, ethene_coords, units="angstrom")
    new_ethene_scf_results = new_ethene_scf_drv.compute(new_ethene, ethene_basis)
    ethene_prop.compute_scf_prop(new_ethene, ethene_basis, new_ethene_scf_results)
    ethene_dipole_moment = ethene_prop.get_property("dipole moment")
    ethene_moments.append(ethene_dipole_moment)

for x in x_list:
    fluoro_coords = opt_fluoroethene.get_coordinates_in_angstrom()
    fluoro_coords += x * fluoroethene_displacements
    new_fluoroethene = vlx.molecule.Molecule(
        fluoroethene_labels, fluoro_coords, units="angstrom"
    )
    new_fluoroethene_scf_results = new_fluoroethene_scf_drv.compute(
        new_fluoroethene, fluoroethene_basis
    )
    ethene_prop.compute_scf_prop(
        new_fluoroethene, fluoroethene_basis, new_fluoroethene_scf_results
    )
    fluoroethene_dipole_moment = fluoroethene_prop.get_property("dipole moment")
    fluoroethene_moments.append(fluoroethene_dipole_moment)


ethene_moments_array = np.array(ethene_moments)
fluoroethene_moments_array = np.array(fluoroethene_moments)

# Plot
figure = plt.figure(figsize=(12, 4))

plt1 = figure.add_subplot(1, 2, 1)
plt.plot(x_list, ethene_moments_array[:, 0], "-o", label="x")
plt.plot(x_list, ethene_moments_array[:, 1], "-o", label="y")
plt.plot(x_list, ethene_moments_array[:, 2], "--o", label="z")
plt.axis(xmin=-0.85, xmax=0.85)
plt.axis(ymin=-0.85, ymax=0.85)
plt.xlabel("Displacement (%)")
plt.ylabel("Dipole moment (a.u.)")
plt.title(
    "Ethene Dipole Moment along the %.2f cm-1 mode" % ethene_vibanalysis_drv.vib_frequencies[-1]
)
plt.legend()

plt2 = figure.add_subplot(1, 2, 2)
plt.plot(x_list, fluoroethene_moments_array[:, 0], "-o", label="x")
plt.plot(x_list, fluoroethene_moments_array[:, 1], "-o", label="y")
plt.plot(x_list, fluoroethene_moments_array[:, 2], "--o", label="z")
plt.axis(xmin=-0.85, xmax=0.85)
plt.axis(ymin=-0.85, ymax=0.85)
plt.xlabel("Displacement (%)")
plt.ylabel("Dipole moment (a.u.)")
plt.title(
    "Fluoroethene dipole moment along the %.2f cm-1 mode"
    % fluoroethene_vibanalysis_drv.vib_frequencies[-1]
)
plt.legend()

plt.tight_layout()
plt.show()
Show code cell output
Ground state dipole moments:   x             y            z

Ethene                     : -0.00 a.u.     0.00 a.u.   -0.00 a.u.
Fluoroethene               : -0.79 a.u.     0.39 a.u.   -0.00 a.u.
Chloroethene               : -0.77 a.u.     0.59 a.u.   -0.00 a.u.
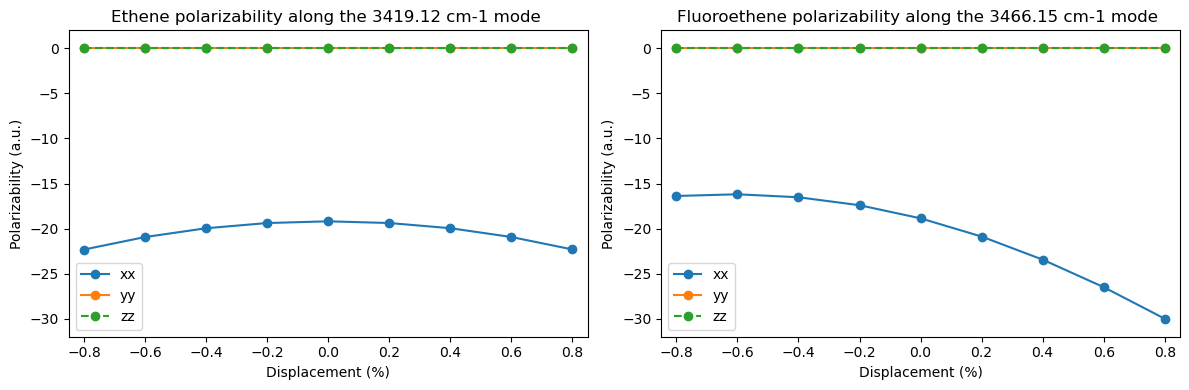
Now select a mode which is Raman-active in ethene, but is suppressed in fluoroethene or chloroethene. Calculate the polarizability of the optimized molecule. How does the polarizability change during the vibration?
# Calculate the polarizability of the optimized molecules
# For this, we need to run a linear response calculation
ethene_lrdrv = vlx.lrsolver.LinearResponseSolver()
ethene_pol_dict = ethene_lrdrv.compute(opt_ethene, ethene_basis, ethene_scf_results)
ethene_polarizability = ethene_pol_dict['response_functions']
...

# Select normal mode and get the array of atomic displacements
...

# Use the atomic displacement array to construct several new molecular configurations
# along the vibrational mode, e.g. -0.75, -0.5, -0.25, 0.25, 0.5, 0.75 displacement
...

# Calculate the polarizability for the new configurations
...

# Plot component or norm as a function of displacement
...
Show code cell source
# Calculate the polarizability of the optimized molecules
# For this, we need to run a linear response calculation
ethene_lrdrv = vlx.lrsolver.LinearResponseSolver()
ethene_lrdrv.ostream.mute()
ethene_pol_dict = ethene_lrdrv.compute(opt_ethene, ethene_basis, ethene_scf_results)
ethene_polarizability = ethene_pol_dict["response_functions"]

fluoroethene_lrdrv = vlx.lrsolver.LinearResponseSolver()
fluoroethene_lrdrv.ostream.mute()
fluoroethene_pol_dict = fluoroethene_lrdrv.compute(
    opt_fluoroethene, fluoroethene_basis, fluoroethene_scf_results
)
fluoroethene_polarizability = fluoroethene_pol_dict["response_functions"]

chloroethene_lrdrv = vlx.lrsolver.LinearResponseSolver()
chloroethene_lrdrv.ostream.mute()
chloroethene_pol_dict = chloroethene_lrdrv.compute(
    opt_chloroethene, chloroethene_basis, chloroethene_scf_results
)
chloroethene_polarizability = chloroethene_pol_dict["response_functions"]

print("Ground state polarizabilities:    xx             yy           zz\n")
print(
    "Ethene                       : %5.2f a.u.    %5.2f a.u.   %5.2f a.u."
    % (
        ethene_polarizability[("x", "x", 0)],
        ethene_polarizability[("y", "y", 0)],
        ethene_polarizability[("z", "z", 0)],
    )
)
print(
    "Fluoroethene                 : %5.2f a.u.    %5.2f a.u.   %5.2f a.u."
    % (
        fluoroethene_polarizability[("x", "x", 0)],
        fluoroethene_polarizability[("y", "y", 0)],
        fluoroethene_polarizability[("z", "z", 0)],
    )
)
print(
    "Chloroethene                 : %5.2f a.u.    %5.2f a.u.   %5.2f a.u."
    % (
        chloroethene_polarizability[("x", "x", 0)],
        chloroethene_polarizability[("y", "y", 0)],
        chloroethene_polarizability[("z", "z", 0)],
    )
)
print()

# Save polarizability dictionary keys
keys = ethene_pol_dict["response_functions"].keys()

ethene_pol = []
fluoroethene_pol = []

# Create new linear response solvers to re-calculate the polarizabilities
new_ethene_lrdrv = vlx.lrsolver.LinearResponseSolver()
new_ethene_lrdrv.ostream.mute()

new_fluoroethene_lrdrv = vlx.lrsolver.LinearResponseSolver()
new_fluoroethene_lrdrv.ostream.mute()

# Calculate the polarizability for different displacements
for x in x_list:
    ethene_coords = opt_ethene.get_coordinates_in_angstrom()
    ethene_coords += x * ethene_displacements
    new_ethene = vlx.molecule.Molecule(ethene_labels, ethene_coords, units="angstrom")
    new_ethene_scf_results = new_ethene_scf_drv.compute(new_ethene, ethene_basis)

    new_ethene_pol_dict = new_ethene_lrdrv.compute(
        new_ethene, ethene_basis, new_ethene_scf_results
    )

    ethene_polarizability = np.zeros((9))
    i = 0
    for key in keys:
        ethene_polarizability[i] = new_ethene_pol_dict["response_functions"][key]
        i += 1
    ethene_pol.append(ethene_polarizability.reshape(3, 3))

for x in x_list:
    fluoro_coords = opt_fluoroethene.get_coordinates_in_angstrom()
    fluoro_coords += x * fluoroethene_displacements
    new_fluoroethene = vlx.molecule.Molecule(
        fluoroethene_labels, fluoro_coords, units="angstrom"
    )
    new_fluoroethene_scf_results = new_fluoroethene_scf_drv.compute(
        new_fluoroethene, fluoroethene_basis
    )

    new_fluoroethene_pol_dict = new_fluoroethene_lrdrv.compute(
        new_fluoroethene, fluoroethene_basis, new_fluoroethene_scf_results
    )

    fluoroethene_polarizability = np.zeros((9))
    i = 0
    for key in keys:
        fluoroethene_polarizability[i] = new_fluoroethene_pol_dict[
            "response_functions"
        ][key]
        i += 1
    fluoroethene_pol.append(fluoroethene_polarizability.reshape(3, 3))

ethene_polarizability_array = np.array(ethene_pol)
fluoroethene_polarizability_array = np.array(fluoroethene_pol)

figure = plt.figure(figsize=(12, 4))

# Plot
plt1 = figure.add_subplot(1, 2, 1)
plt.plot(x_list, ethene_polarizability_array[:, 0, 0], "-o", label="xx")
plt.plot(x_list, ethene_polarizability_array[:, 1, 1], "-o", label="yy")
plt.plot(x_list, ethene_polarizability_array[:, 2, 2], "--o", label="zz")
plt.axis(xmin=-0.85, xmax=0.85)
plt.axis(ymin=-32.0, ymax=2.0)
plt.xlabel("Displacement (%)")
plt.ylabel("Polarizability (a.u.)")
plt.title(
    "Ethene polarizability along the %.2f cm-1 mode "
    % (ethene_vibanalysis_drv.vib_frequencies[-1])
)
plt.legend()

plt2 = figure.add_subplot(1, 2, 2)
plt.plot(x_list, fluoroethene_polarizability_array[:, 0, 0], "-o", label="xx")
plt.plot(x_list, fluoroethene_polarizability_array[:, 1, 1], "-o", label="yy")
plt.plot(x_list, fluoroethene_polarizability_array[:, 2, 2], "--o", label="zz")
plt.axis(xmin=-0.85, xmax=0.85)
plt.axis(ymin=-32.0, ymax=2.0)
plt.xlabel("Displacement (%)")
plt.ylabel("Polarizability (a.u.)")
plt.title(
    "Fluoroethene polarizability along the %.2f cm-1 mode "
    % (fluoroethene_vibanalysis_drv.vib_frequencies[-1])
)
plt.legend()

plt.tight_layout()
plt.show()
Show code cell output
Ground state polarizabilities:    xx             yy           zz

Ethene                       : -19.19 a.u.    -32.45 a.u.   -7.15 a.u.
Fluoroethene                 : -18.86 a.u.    -30.62 a.u.   -7.81 a.u.
Chloroethene                 : -31.94 a.u.    -41.05 a.u.   -10.12 a.u.